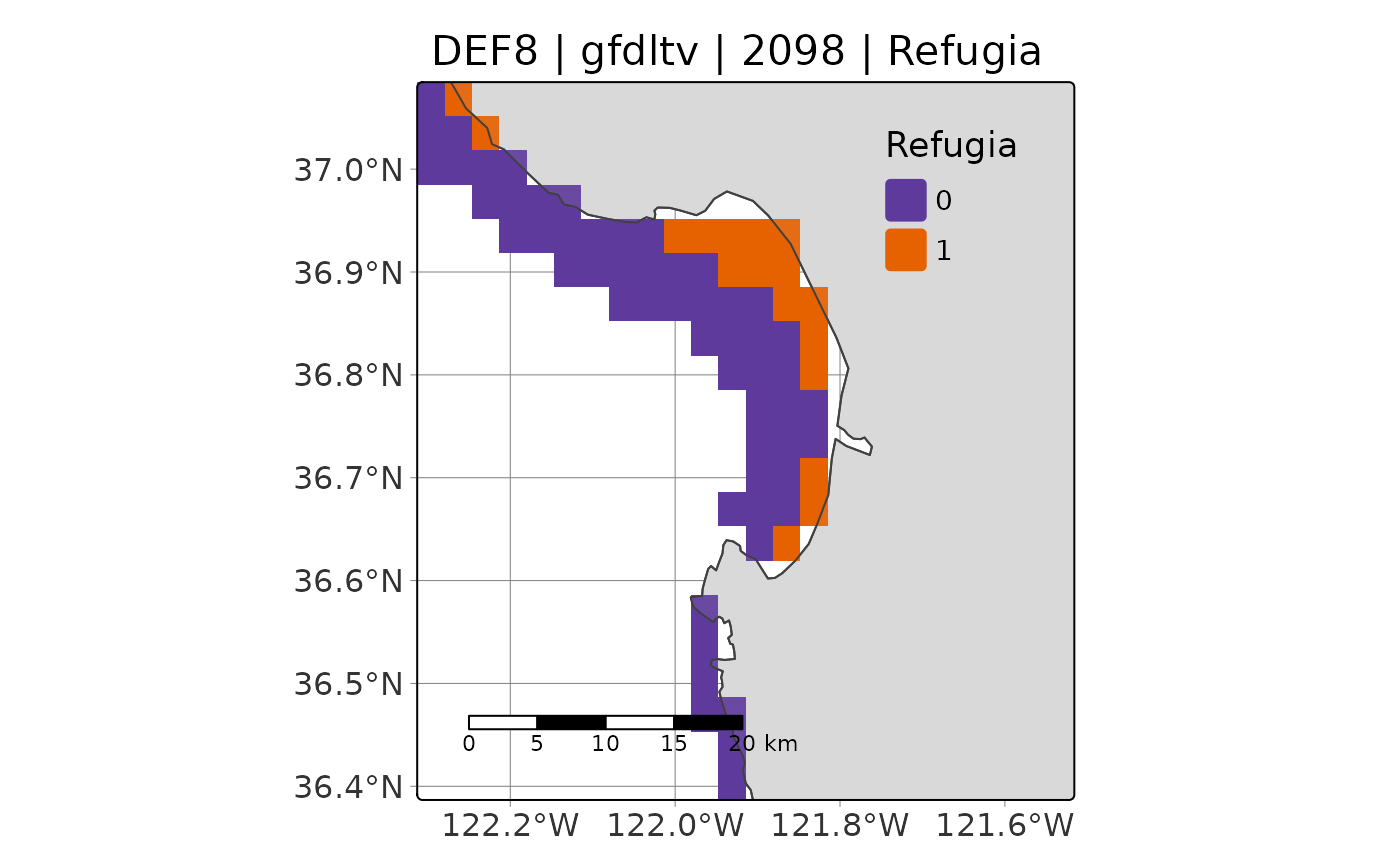
This produces a nice tmap object that shows binary refugia for the year of interest
Usage
viz_refugia(
  yr = 2100,
  esm = c("gfdltv", "hadtv", "ipsltv", "ens"),
  area = c("monterey_bay", "channel_islands", "fort_bragg", "san_francisco"),
  def = "def8",
  extent_list = abalone::extent_list,
  infile = abalone::percentdays,
  persist_thresh = c(50, 95)
)
Arguments
- yr
Numeric vector. Year to plot. Default is 2100.
- esm
ESM model. Choose one from
c("gfdltv", "hadtv", "ipsltv", "ens")- area
Character. Name of the area; must match a key in
abalone::extent_list.- def
Character. Refugia definition name (e.g., "def8") used in input file paths.
- extent_list
List of vectors. Defaults to
abalone::extent_list- infile
Input dataframe detailing % stress per year. Defaults to
abalone::percentdays.- persist_thresh
Integer. Temporal threshold (%) used for defining annual refugia. Choose either 50 (liberal) or 95% (conservative).
Examples
viz_refugia(yr = 2098, esm = "gfdltv", area = "monterey_bay",
def = "def8", extent_list = abalone::extent_list, infile = abalone::percentdays,
persist_thresh = 50)