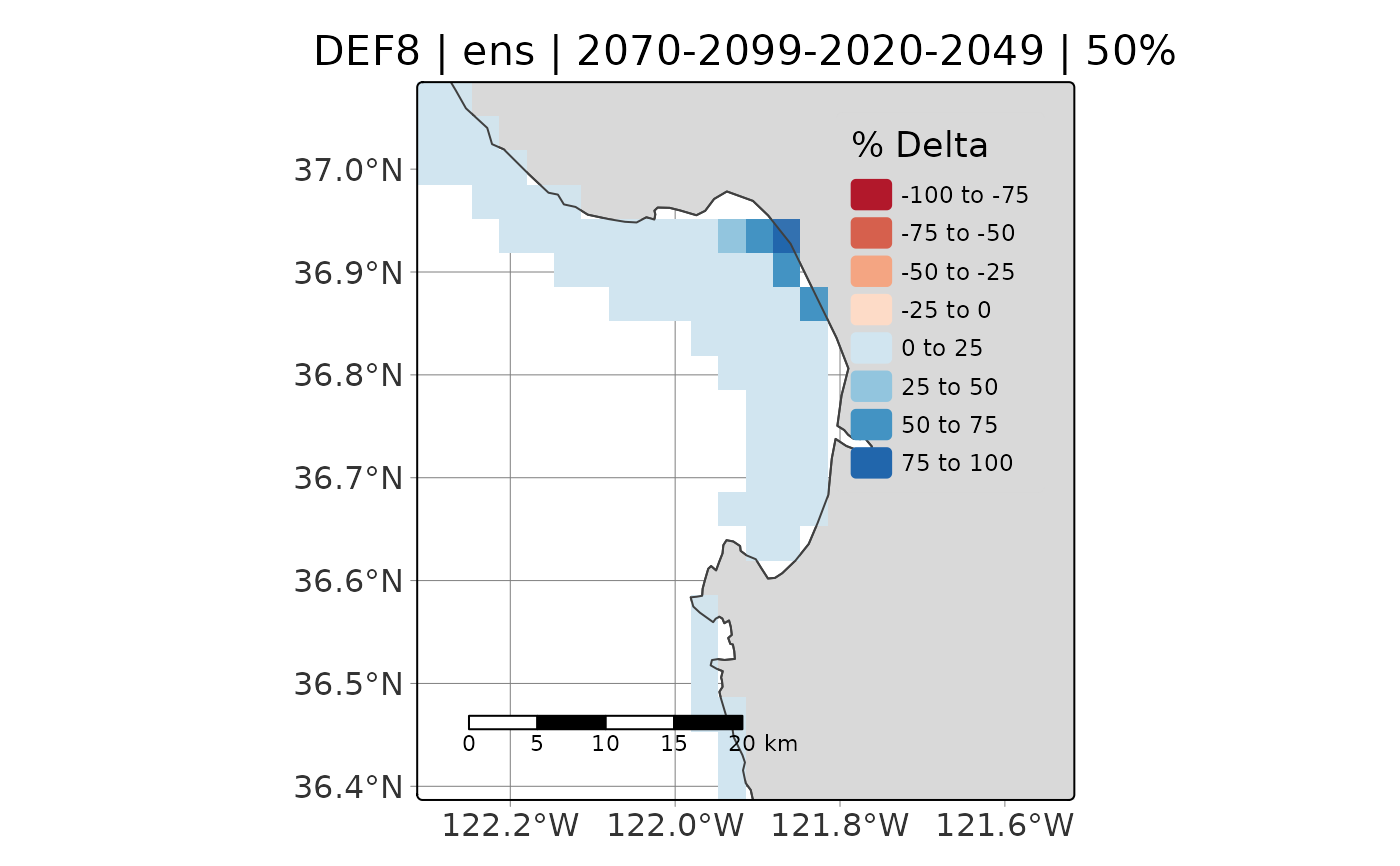
This produces a nice tmap object that shows delta refugia (%) for the time period of interest
Usage
viz_delta(
  esm = c("gfdltv", "hadtv", "ipsltv", "ens"),
  area = c("monterey_bay", "channel_islands", "fort_bragg", "san_francisco"),
  def = "def8",
  hist_range = 2020:2049,
  proj_range = 2070:2099,
  extent_list = abalone::extent_list,
  persist_thresh = c(50, 95),
  save_path = NULL
)
Arguments
- esm
ESM model. Choose one from
c("gfdltv", "hadtv", "ipsltv", "ens")- area
Character. Name of the area; must match a key in
abalone::extent_list.- def
Character. Refugia definition name (e.g., "def8") used in input file paths.
- hist_range
Vector of integers. Time period for historical period
- proj_range
Vector of integers. Time period for projection period
- extent_list
List of vectors. Defaults to
abalone::extent_list- persist_thresh
Integer. Temporal threshold (%) used for defining annual refugia. Choose either 50 (liberal) or 95% (conservative).
- save_path
Character. Directory to save output to. Optional, set to NULL if not needed.
Examples
viz_delta(esm = "ens", area = "monterey_bay", def = "def8",
hist_range = 2020:2049, proj_range = 2070:2099,
extent_list = abalone::extent_list, persist_thresh = 50, save_path = NULL)