Plot percent of days meeting refugia conditions over time
Source:R/ts_viz_percentdays.R
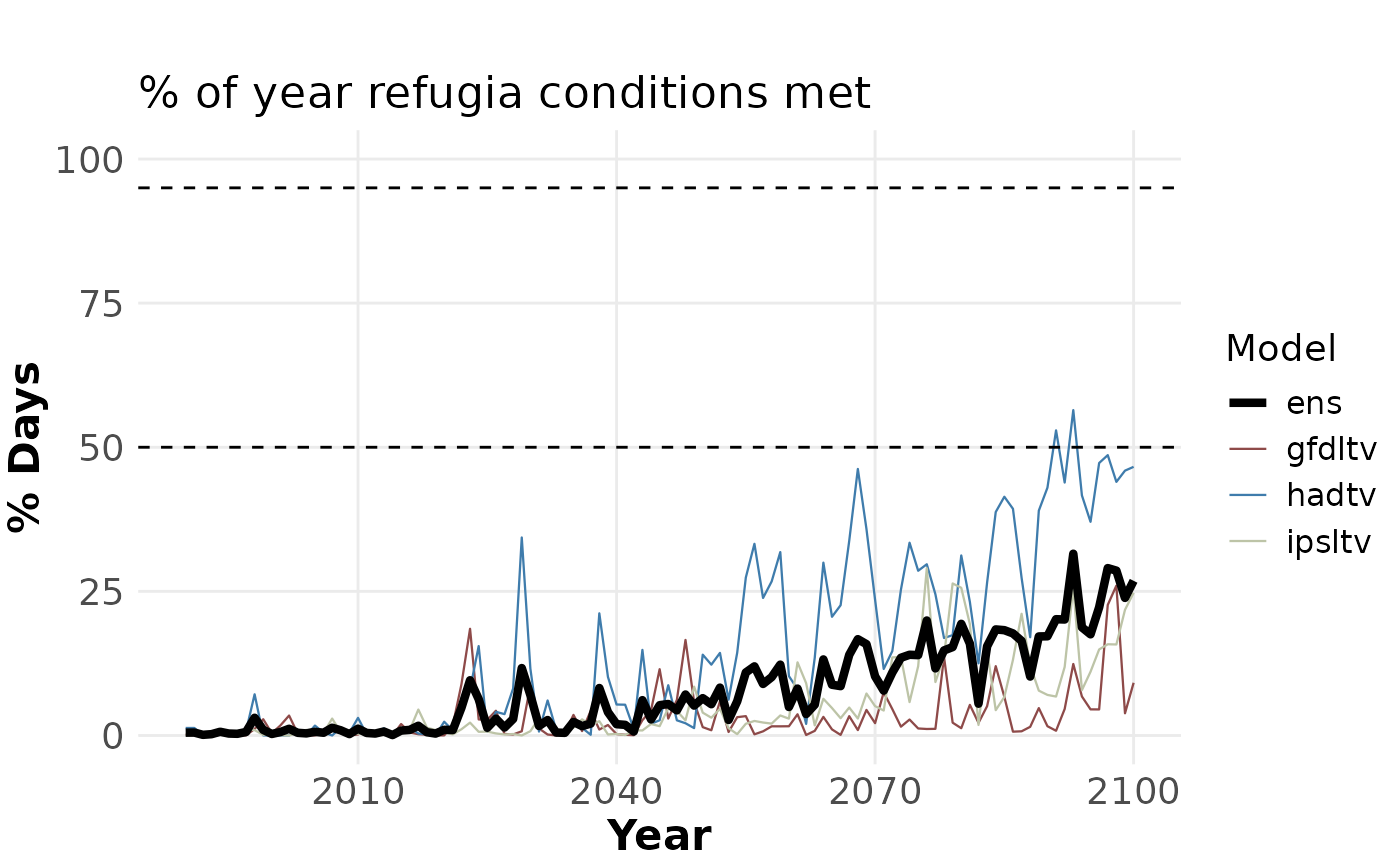
ts_viz_percentdays.RdThis function produces a ggplot2 object of an annual time series of refugia
across all ESMs, including the ensemble mean. The plot includes dashed horizontal
lines for the two temporal thresholds used to define refugia: 95 and 50%. Note
this function will only work for refugia definitions that are calculated using
% of year defined as refugia (i.e., not Definitions 1-2).
Usage
ts_viz_percentdays(
  area = c("monterey_bay", "channel_islands", "fort_bragg", "san_francisco"),
  yr_range = 1990:2100,
  def = "def8",
  input_file = abalone::percentdays,
  cons_thresh = 95,
  lib_thresh = 50,
  extent_list = abalone::extent_list,
  plot_title = "% of year refugia conditions met"
)
Arguments
- area
Character. Name of the area; must match a key in
abalone::extent_list.- yr_range
Numeric vector. Range of years to include. Default is 1990–2100.
- def
Character. Refugia definition name (e.g., "def8") used in input file paths.
- input_file
R Object. Dataframe of % of year stressed. Defaults to
abalone::percentdays- cons_thresh
Integer. Value representing the conservative temporal threshold to define refugia. Defaults to 95(%)
- lib_thresh
Integer. Value representing the liberal temporal threshold to define refugia. Defaults to 50(%)
- extent_list
List of vectors. Defaults to
abalone::extent_list- plot_title
Character string. Title displayed on the
ggplot
Value
Produces a ggplot2::ggplot object of an annual time series of refugia.
Examples
ts_viz_percentdays(area = "monterey_bay", yr_range = 1990:2100, def = "def8",
input_file = abalone::percentdays, cons_thresh = 95, lib_thresh = 50)
#> Warning: Using `size` aesthetic for lines was deprecated in ggplot2 3.4.0.
#> ℹ Please use `linewidth` instead.
#> ℹ The deprecated feature was likely used in the abalone package.
#>   Please report the issue at <https://github.com/JessicaBolin/abalone/issues>.